Metrics
Overview
For the overall design of Dubbo Metrics, please refer to Observability Metrics Proposal .
The following explains the specific implementation and usage related to Dubbo Java.
Usage
To enable metric collection for the Dubbo process, you need to introduce relevant dependencies and add configurations in your project. For example, in a Spring Boot project, add the following spring-boot-starter dependency to automatically enable metric collection.
<!-- https://mvnrepository.com/artifact/org.apache.dubbo/dubbo-metrics-prometheus -->
<dependency>
    <groupId>org.apache.dubbo</groupId>
    <artifactId>dubbo-spring-boot-observability-starter</artifactId>
    <version>3.2.0</version>
</dependency>
- For a complete example, please refer to dubbo-samples-metrics-spring-boot
- For complete configuration parameters, please refer to Metrics Configuration Manual
Implementation Principle Analysis
Code Structure and Workflow
- Remove the original classes related to Metrics.
- Create new modules dubbo-metrics/dubbo-metrics-api, dubbo-metrics/dubbo-metrics-prometheus, with MetricsConfig as the configuration class for these modules.
- Use Micrometer, representing metrics with primitive types like Long, Double, etc., and introduce Micrometer in dubbo-metrics-api, letting Micrometer convert internal metrics.
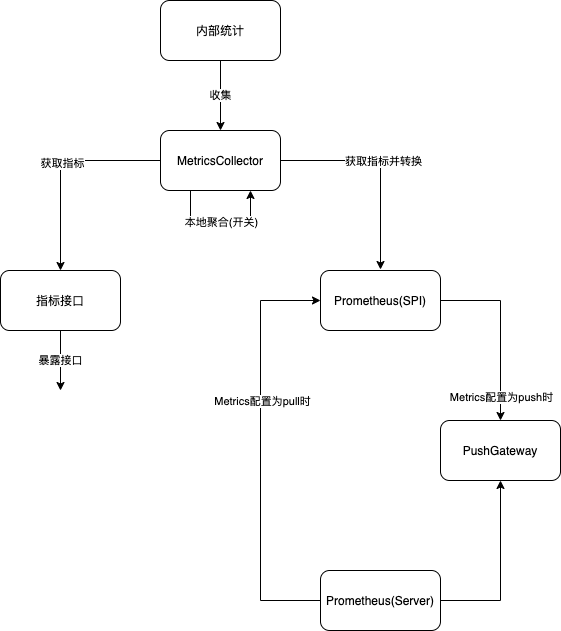
The following are the key components and data flow in the Dubbo implementation:

Metrics Reporting Interface
According to the architecture in the above figure, the metrics interface is the exit for Dubbo to expose metric data. Here is the specific definition of the metrics interface:
Additionally, this Service also serves as a data source for some Intelligent Adaptive Traffic Scheduling Algorithms
public interface MetricsService {

    /**
     * Default {@link MetricsService} extension name.
     */
    String DEFAULT_EXTENSION_NAME = "default";

    /**
     * The contract version of {@link MetricsService}, the future update must make sure compatible.
     */
    String VERSION = "1.0.0";

    /**
     * Get metrics by prefixes
     *
     * @param categories categories
     * @return metrics - key=MetricCategory value=MetricsEntityList
     */
    Map<MetricsCategory, List<MetricsEntity>> getMetricsByCategories(List<MetricsCategory> categories);

    /**
     * Get metrics by interface and prefixes
     *
     * @param serviceUniqueName serviceUniqueName (eg.group/interfaceName:version)
     * @param categories categories
     * @return metrics - key=MetricCategory value=MetricsEntityList
     */
    Map<MetricsCategory, List<MetricsEntity>> getMetricsByCategories(String serviceUniqueName, List<MetricsCategory> categories);

    /**
     * Get metrics by interface、method and prefixes
     *
     * @param serviceUniqueName serviceUniqueName (eg.group/interfaceName:version)
     * @param methodName methodName
     * @param parameterTypes method parameter types
     * @param categories categories
     * @return metrics - key=MetricCategory value=MetricsEntityList
     */
    Map<MetricsCategory, List<MetricsEntity>> getMetricsByCategories(String serviceUniqueName, String methodName, Class<?>[] parameterTypes, List<MetricsCategory> categories);
}
The design of MetricsCategory is as follows:
public enum MetricsCategory {
    RT,
    QPS,
    REQUESTS,
}
The design of MetricsEntity is as follows:
public class MetricsEntity {
    private String name;
    private Map<String, String> tags;
    private MetricsCategory category;
    private Object value;
}
Metrics Collection Tracking
Dubbo intercepts request call metrics through the extended Filter SPI. Currently, Filter extension implementations have been added for both consumer and provider sides:
- MetricsFilter provides request metrics tracking for the provider.
- MetricsClusterFilter provides request metrics tracking for the consumer.
The implementation source code for MetricsFilter is as follows; note the try-catch-finally handling.
@Activate(group = PROVIDER, order = -1)
public class MetricsFilter implements Filter, ScopeModelAware {
    @Override
    public Result invoke(Invoker<?> invoker, Invocation invocation) throws RpcException {
        collector.increaseTotalRequests(interfaceName, methodName, group, version);
        collector.increaseProcessingRequests(interfaceName, methodName, group, version);
        Long startTime = System.currentTimeMillis();
        try {
            Result invoke = invoker.invoke(invocation);
            collector.increaseSucceedRequests(interfaceName, methodName, group, version);
            return invoke;
        } catch (RpcException e) {
            collector.increaseFailedRequests(interfaceName, methodName, group, version);
            throw e;
        } finally {
            Long endTime = System.currentTimeMillis();
            Long rt = endTime - startTime;
            collector.addRT(interfaceName, methodName, group, version, rt);
            collector.decreaseProcessingRequests(interfaceName, methodName, group, version);
        }
    }
}
Metric Statistics Units
The following five attributes are the basic units of metric statistics (a combination of application, service, and method), which are also the keys in the Map data structure of the source code MetricsCollector.
public class MethodMetric {
    private String applicationName;
    private String interfaceName;
    private String methodName;
    private String group;
    private String version;
}
Basic Metrics
The MetricsCollector under the dubbo-common module is responsible for storing all metric data.
public class DefaultMetricsCollector implements MetricsCollector {
    private Boolean collectEnabled = false;
    private final List<MetricsListener> listeners = new ArrayList<>();
    private final ApplicationModel applicationModel;
    private final String applicationName;

    private final Map<MethodMetric, AtomicLong> totalRequests = new ConcurrentHashMap<>();
    private final Map<MethodMetric, AtomicLong> succeedRequests = new ConcurrentHashMap<>();
    private final Map<MethodMetric, AtomicLong> failedRequests = new ConcurrentHashMap<>();
    private final Map<MethodMetric, AtomicLong> processingRequests = new ConcurrentHashMap<>();

    private final Map<MethodMetric, AtomicLong> lastRT = new ConcurrentHashMap<>();
    private final Map<MethodMetric, LongAccumulator> minRT = new ConcurrentHashMap<>();
    private final Map<MethodMetric, LongAccumulator> maxRT = new ConcurrentHashMap<>();
    private final Map<MethodMetric, AtomicLong> avgRT = new ConcurrentHashMap<>();
    private final Map<MethodMetric, AtomicLong> totalRT = new ConcurrentHashMap<>();
    private final Map<MethodMetric, AtomicLong> rtCount = new ConcurrentHashMap<>();
 }
Local Metric Aggregation
Local aggregation refers to the process of obtaining various quantiles’ metrics by calculating some simple metrics.
Enabling Local Aggregation
When collecting metrics, only the basic metrics are collected by default; some single-machine aggregation metrics need to have service flexibility or local aggregation enabled, and then a separate thread is started for calculation.
dubbo.metrics.enable=true
Additionally, more metrics can be set.
dubbo.metrics.aggregation.enable=true
dubbo.metrics.aggregation.bucket-num=5
dubbo.metrics.aggregation.time-window-seconds=10
Specific Metrics
For specific metrics, please refer to the overall design document of Dubbo Metrics.
Aggregation Collector Implementation
public class AggregateMetricsCollector implements MetricsCollector, MetricsListener {
    private int bucketNum;
    private int timeWindowSeconds;

    private final Map<MethodMetric, TimeWindowCounter> totalRequests = new ConcurrentHashMap<>();
    private final Map<MethodMetric, TimeWindowCounter> succeedRequests = new ConcurrentHashMap<>();
    private final Map<MethodMetric, TimeWindowCounter> failedRequests = new ConcurrentHashMap<>();
    private final Map<MethodMetric, TimeWindowCounter> qps = new ConcurrentHashMap<>();
    private final Map<MethodMetric, TimeWindowQuantile> rt = new ConcurrentHashMap<>();

    private final ApplicationModel applicationModel;

    private static final Integer DEFAULT_COMPRESSION = 100;
    private static final Integer DEFAULT_BUCKET_NUM = 10;
    private static final Integer DEFAULT_TIME_WINDOW_SECONDS = 120;

//Configuration parsing in the constructor

    public AggregateMetricsCollector(ApplicationModel applicationModel) {
        this.applicationModel = applicationModel;
        ConfigManager configManager = applicationModel.getApplicationConfigManager();
        MetricsConfig config = configManager.getMetrics().orElse(null);
        if (config != null && config.getAggregation() != null && Boolean.TRUE.equals(config.getAggregation().getEnabled())) {
            // only registered when aggregation is enabled.
            registerListener();

            AggregationConfig aggregation = config.getAggregation();
            this.bucketNum = aggregation.getBucketNum() == null ? DEFAULT_BUCKET_NUM : aggregation.getBucketNum();
            this.timeWindowSeconds = aggregation.getTimeWindowSeconds() == null ? DEFAULT_TIME_WINDOW_SECONDS : aggregation.getTimeWindowSeconds();
        }
    }
}
If local aggregation is enabled, Spring’s BeanFactory adds listeners to bind AggregateMetricsCollector with DefaultMetricsCollector, implementing a producer-consumer pattern. DefaultMetricsCollector uses a listener list for easy expansion.
private void registerListener() {
    applicationModel.getBeanFactory().getBean(DefaultMetricsCollector.class).addListener(this);
}
Metric Aggregation Principle
Sliding Window
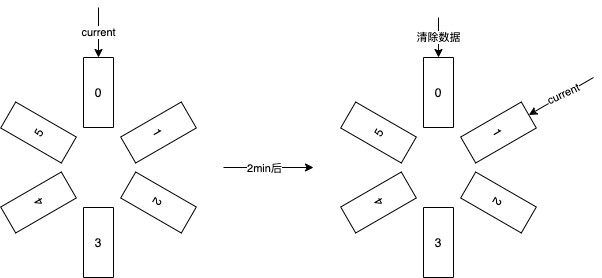
Assuming we have initially 6 buckets, each window time is set to 2 minutes.
Each time metric data is written, it will be written into the 6 buckets, moving a bucket every two minutes and clearing the original data.
When reading metrics, it reads from the current bucket to achieve the sliding window effect. The specific reference is shown in the following diagram, where the current bucket stores data within the configured bucket lifecycle, i.e., recent data.

In each bucket, the TDigest algorithm is used to calculate quantile metrics.
TDigest Algorithm (high accuracy for extreme quantiles like p1, p99, lower accuracy for intermediate quantiles like p50). Relevant materials are as follows:
The code implementation is as follows. In addition to the TimeWindowQuantile used to calculate quantile metrics, another TimeWindowCounter is provided to collect the count of metrics within the time interval.
public class TimeWindowQuantile {
    private final double compression;
    private final TDigest[] ringBuffer;
    private int currentBucket;
    private long lastRotateTimestampMillis;
    private final long durationBetweenRotatesMillis;

    public TimeWindowQuantile(double compression, int bucketNum, int timeWindowSeconds) {
        this.compression = compression;
        this.ringBuffer = new TDigest[bucketNum];
        for (int i = 0; i < bucketNum; i++) {
            this.ringBuffer[i] = TDigest.createDigest(compression);
        }

        this.currentBucket = 0;
        this.lastRotateTimestampMillis = System.currentTimeMillis();
        this.durationBetweenRotatesMillis = TimeUnit.SECONDS.toMillis(timeWindowSeconds) / bucketNum;
    }

    public synchronized double quantile(double q) {
        TDigest currentBucket = rotate();
        return currentBucket.quantile(q);
    }

    public synchronized void add(double value) {
        rotate();
        for (TDigest bucket : ringBuffer) {
            bucket.add(value);
        }
    }

    private TDigest rotate() {
        long timeSinceLastRotateMillis = System.currentTimeMillis() - lastRotateTimestampMillis;
        while (timeSinceLastRotateMillis > durationBetweenRotatesMillis) {
            ringBuffer[currentBucket] = TDigest.createDigest(compression);
            if (++currentBucket >= ringBuffer.length) {
                currentBucket = 0;
            }
            timeSinceLastRotateMillis -= durationBetweenRotatesMillis;
            lastRotateTimestampMillis += durationBetweenRotatesMillis;
        }
        return ringBuffer[currentBucket];
    }
}
Metric Push
Metric push is only enabled when the user sets the parameter dubbo.metrics.protocol=prometheus. If only metric aggregation is enabled, metrics will not be pushed by default.
Prometheus Pull Service Discovery
Currently, Dubbo Admin has a built-in Prometheus HTTP_SD service discovery instance address discovery mechanism. Admin will default to using the qos port and /metrics, allowing Admin to gather all instance addresses and sync to the Prometheus Server in a standard HTTP_SD format.
The specific configuration method is as follows:
Here, address, port, and url are all optional items. If not configured, Admin will use default convention values.
Users can directly configure the address of the Prometheus Pushgateway in the Dubbo configuration file, such as <dubbo:metrics protocol=“prometheus” mode=“push” address="${prometheus.pushgateway-url}" interval=“5” />, where interval represents the push interval.